
How Immigration Patterns Have Impacted U.S. Wine Consumption
They have and are playing a role in the downturn in wine consumption


The list of reasons that numerous people and institutions have given to explain the multi-year drop in U.S. wine consumption is long: the economy, generational differences in risk-taking, neo-prohibitionism’s ascent, a faltering economy, inflation, alternatives to wine, poor marketing, and weight-loss drugs…just to name some of the reasons on offer. But there is one under-discussed factor that deserves more attention—immigration patterns.
First, some background. Between 1960 and 1982, Americans continually increased their total wine consumption. A dip in consumption was experienced between 1983 and 1987. Between 1987 and 2016, there was a near continuous increase in total gallons of wine consumed as well as in per capita wine consumption. What looks to be a plateau in wine consumption begins around 2016. However, the buying spree that occurred during COVID makes it difficult to discern trendlines. But what it looks like is that the COVID buying spree interrupted what was a plateauing and then a real decline in consumption. According to the California Wine Institute, between 2022 and 2023, total table wine consumption declined by 70 million gallons. Per capita wine consumption declined by 9.5%. The 2024 numbers are estimated to be worse, and 2025 isn’t looking any better.
Given this, let’s start with an idea that should not be controversial. A person’s proclivity for wine drinking is highly influenced by their culture. Those influences are developed over long periods of time and themselves are dependent on geographical factors, migration patterns, governmental institutions, climate, and more.
As a result, Western Europe and some of its colonial progeny are heavy wine drinkers. Think France, Italy, Spain, Argentina, Chile, etc. On the other hand, cultural factors have made per capita wine consumption in other parts of the globe relatively small. Think Africa, most of Latin America, and most of Asia. According to the World Population Review, the vast majority of the countries that do not count wine as an important part of their culture see annual per capita consumption rates below 1 liter. Places like Portugal, France, Spain, and Italy see consumption rates between 20 and 50 liters. The U.S. and Canada have per capita wine consumption rates between 7 and 9 liters.
Between 1960 and 2019, U.S. per capita wine consumption increased by 300%. Imagining the COVID boost in consumption had never happened, it appears that U.S. per capita wine consumption has been decreasing since 2017. That figure will continue to decrease as immigration patterns to the U.S. continue to feature a majority of immigrants coming from cultures where wine is relatively unimportant.
Below is a comparison of the regions of origin of immigrants in 1960 and 2024.
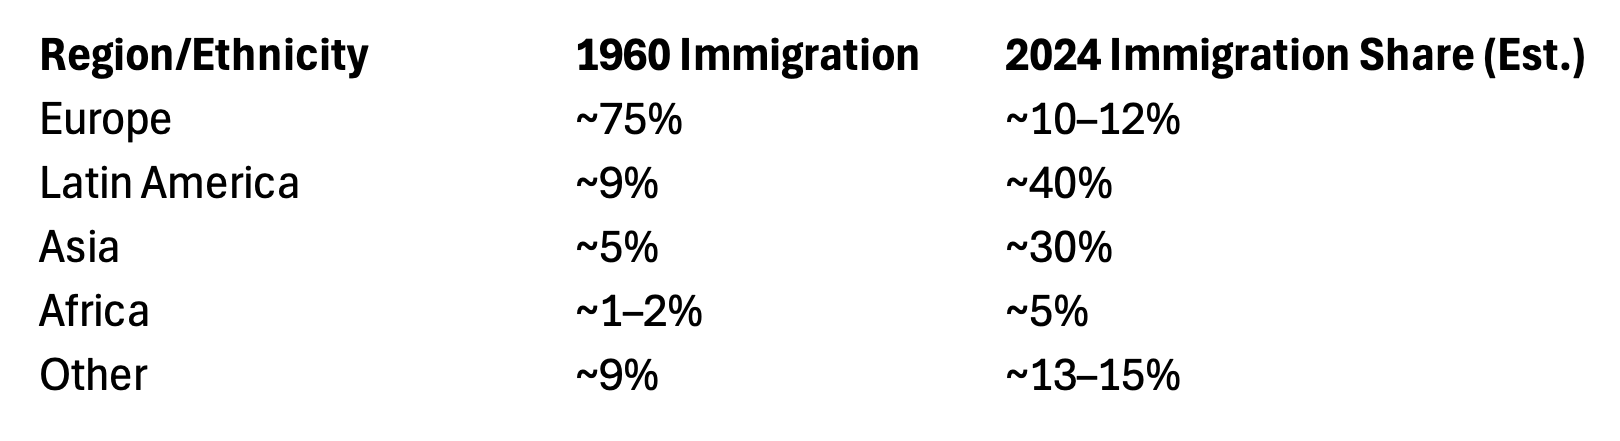
The change in the origin of immigrants is significant. In 1960 and for all of U.S. history prior, Europe (where wine culture is much more embedded) was the source of the overwhelming majority of immigrants. In 1965, the U.S. passed the 1965 Immigration and Nationality Act. That act replaced an immigration quota system that prioritized immigrants from northern and western Europe and replaced it with a system emphasizing family unification, immigrants with skills needed in the U.S., and refugee status. The result was a tremendous increase in immigrants from the Global South and Asia (regions where very little emphasis on wine was embedded in the cultures).