The Miracle of the Vintage Charts
In most cases the different charts agree on the quality of a region's vintage, but what's impressive is how they fit so much info into such a small space.
Over the past few months, I’ve been working on a project in which the character and quality of vintages across the globe’s winemaking regions are described. The key to this project is finding data on the character of the growing seasons in different parts of the world. This is often much more difficult for older vintages. But after now having spent a good deal of time on this effort, a few things are clear.
First, it’s interesting to note that the saying, “every year in California is a vintage year” is pretty much on the mark. This is particularly the case when comparing growing seasons in California with growing seasons across Europe where the volatility of weather is much greater and often harvest ruining. The number of European vintages in which the growing season is described as having been “hit by torrential rains” or been subject to “muggy, hot and rot inducing weather” is a regular occurrence.
You don’t see this in descriptions of California growing seasons, no matter how far back you look. At worst you read about 2 or 3 day heat spikes or the occasional rainstorm during harvest. Incidentally, descriptions of Australian growing seasons are similar in their temperateness to California.
What’s also becomes clear about this kind of work I’ve been doing is that the results, the descriptions of what growing conditions in the Cote Du Nuits were like in 1979 and the general quality of the wines following the growing season, are useful for an extraordinarily tiny percent of the wine-drinking public. Unless you are an independent fine wine retailer with a fairly deep selection of older wines or if you are a buyer of aged wines or if you are in the market for a birthday or anniversary wine, you really don’t need to know this information. In fact, if you are like the vast majority of wine drinkers you are buying wine today for drinking tonight or you will be drinking that $400 “splurge wine” you picked up in Napa on holiday sometime in the next couple of years.
So you can assume the work I’ve been doing on vintages is meant to appeal to a very small sector of the wine-drinking population.
Part of this project is surveying different vintage charts produced by wine media organizations and critics. The fact is that in researching a particular vintage in Bordeaux or Burgundy or Oregon, I could just look at a single reliable vintage chart since when looking at a number of them, there really isn’t wide variation among critics in their assessment of a vintage. This is to say, The quality of a particular vintage is rarely up for debate. The rain during harvest either completely diluted the quality of the grapes or it did not. Occasionally you come across a debate of “just how great is this vintage”, but even those instances are rare, if not interesting.
I want to show you how some different vintage charts display information about vintages. There is some variation across organizations and critics, but all of these will have a similar appearance to them.
WINE-SEARCHER
The most interesting thing about the Wine Searcher vintage charts is that 1) their ratings are based on their aggregation of OTHER critics’ assessments, 2) their charthows attempted to be far more detailed on a regional basis than other charts (In 2014 the Coombsville vintage in Napa Valley was rated 92 while the Saint Helena AVA vintage the same year was rated 94), and 3) the Wine Searcher vintage chart leaves out one key element: Drinking window. They don’t offer an assessment as to whether or not the 1999 Mount Veeder wines are still drinking well, if they should be held or if they are over the hill.
WINE SPECTATOR
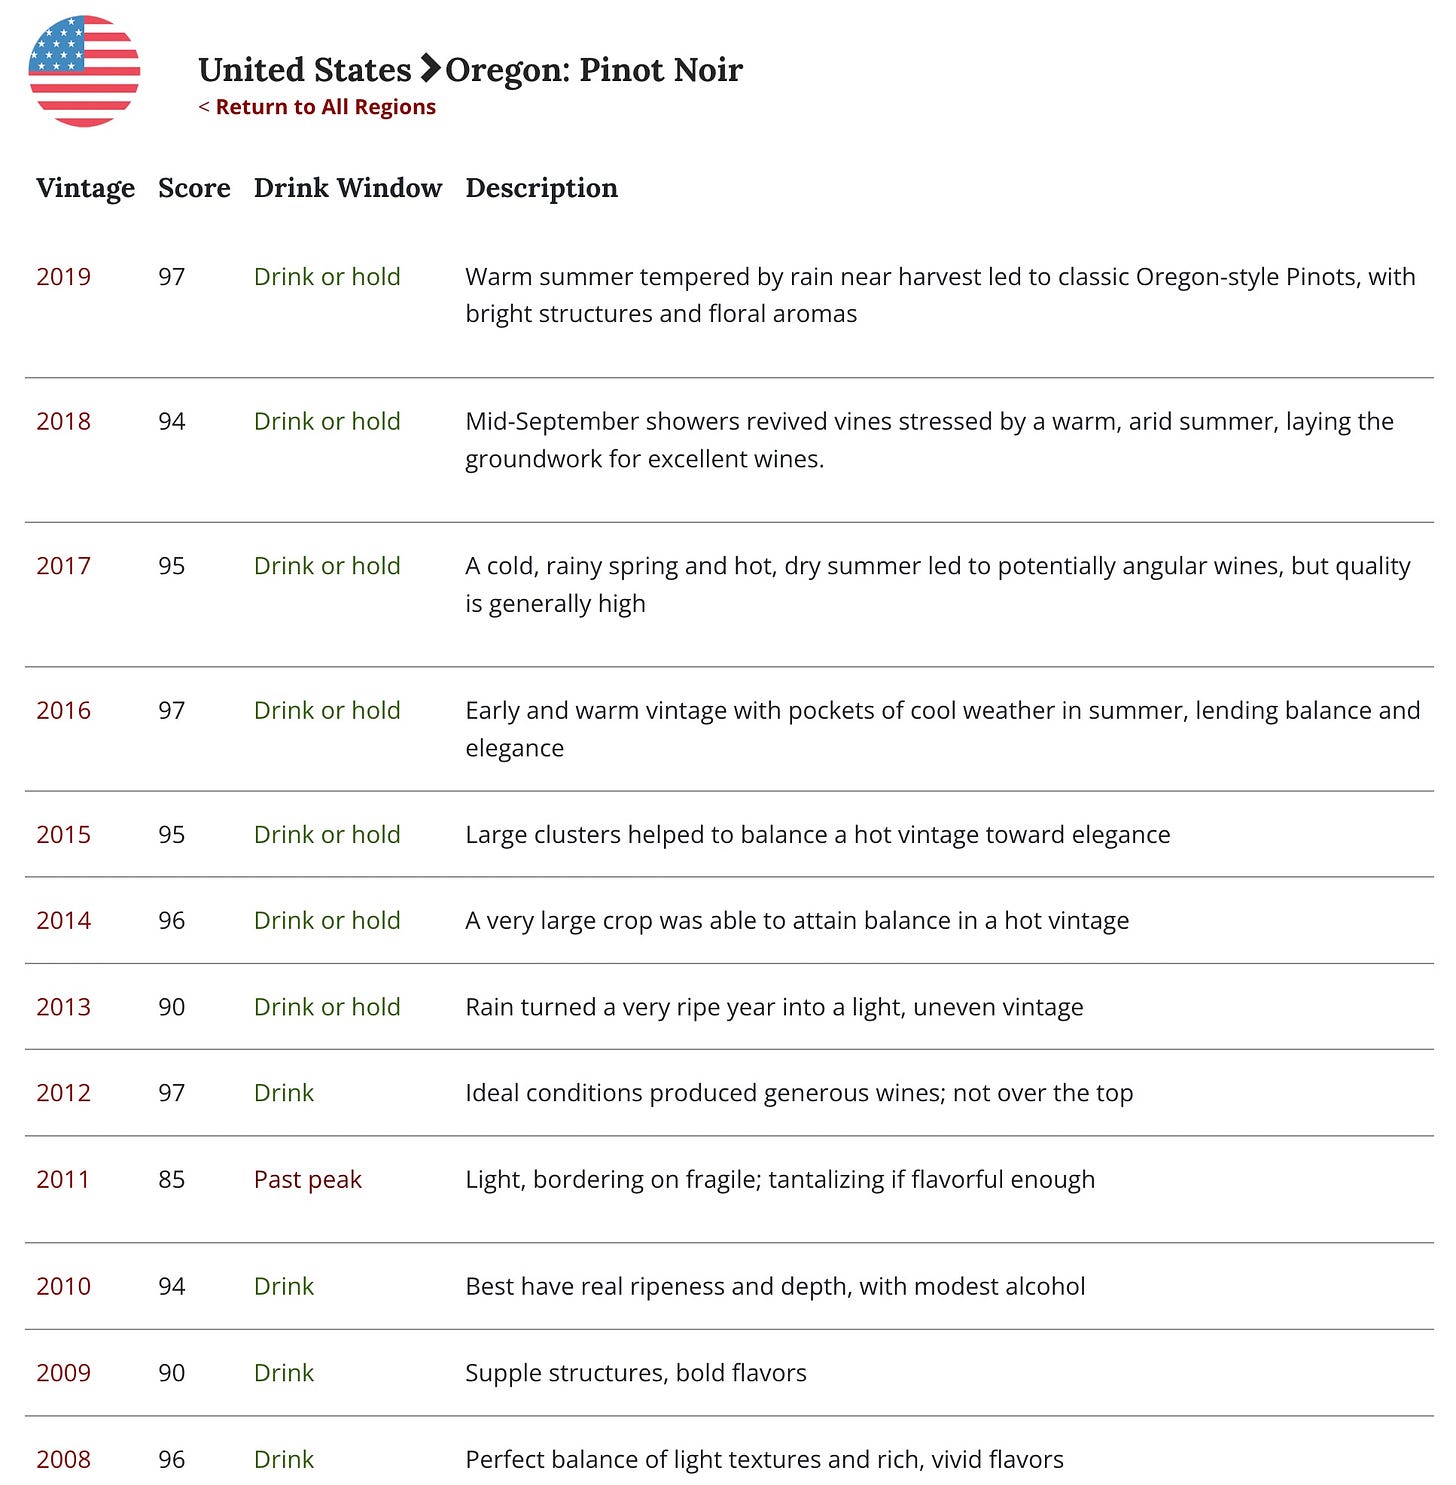
Wine Spectator’s reviews and ratings of vintages are of their own assessment, as they should be. Theirs is a straightforward presentation that also offers, helpfully, short commentary on the vintage in a given region. As you can see, the 90-point 2013 vintage in Oregon was, in their opinion, marred by rains toward the end of the season and diluted the quality of some wines. This is a good place to note something important. As most other charts provide, the Wine Spectator takes a stab at determining whether the wines from a particular place and time should be drunk, held or if they are past their peak. What’s notable is that the best we can tell about the important point of WHEN this assessment of the wines was made is that it was determined as of 2019, the last vintage assessment they provide.
ROBERT PARKER’S WINE ADVOCATE
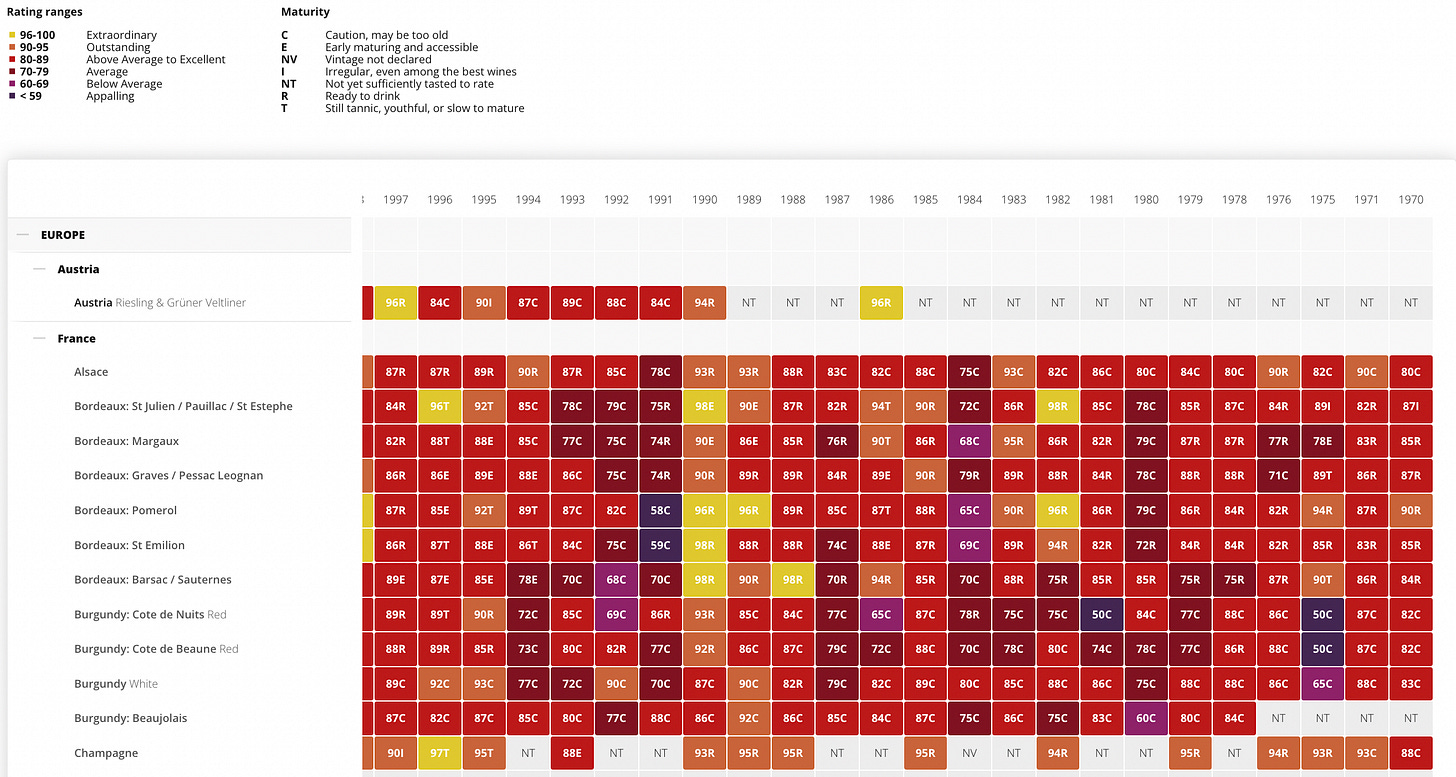
The Wine Advocate’s vintage chart, also based on the organization’s own assessment of a time and place, is rather straightforward and economical. Their attempt to assess the “maturity” of a region’s wines based on vintage is interesting. Their categories include “Caution, may be too old” as well as “Early Maturing and accessible”.
JEB DUNNICK
Mr. Dunnick’s vintage chart layout is very similar to the Wine Spectators. Additionally, Dunnick’s definitions of vintage ratings highlight the interesting language used to explain the ratings. Any vintage rated below 59 is considered “Disastrous”, which I assume includes an embrace of the advice Dunnick gives for vintages rated 60-69: “Best to Avoid”.
WINE ENTHUSIAST
The Wine Enthusiast’s vintage chart should, by now, look familiar with its grid layout, color coding for maturity levels, and ratings of vintage by region. I’d only note one thing that stands out. Those dark grey boxes located primarily on the right side of the grid and indicating older vintages indicate “In decline, may be undrinkable”. Well, I’m here to guarantee you that 2005 Sonoma Cabernets and Pinot Noirs, 2008 California South Coast Syrahs, 2000 Napa Cabs, 2000-2003 Willamette Valley Pinot Noirs, and 2009 Finger Lake Rieslings are not even possibly “undrinkable”.
BERRY, BROS & RUDD
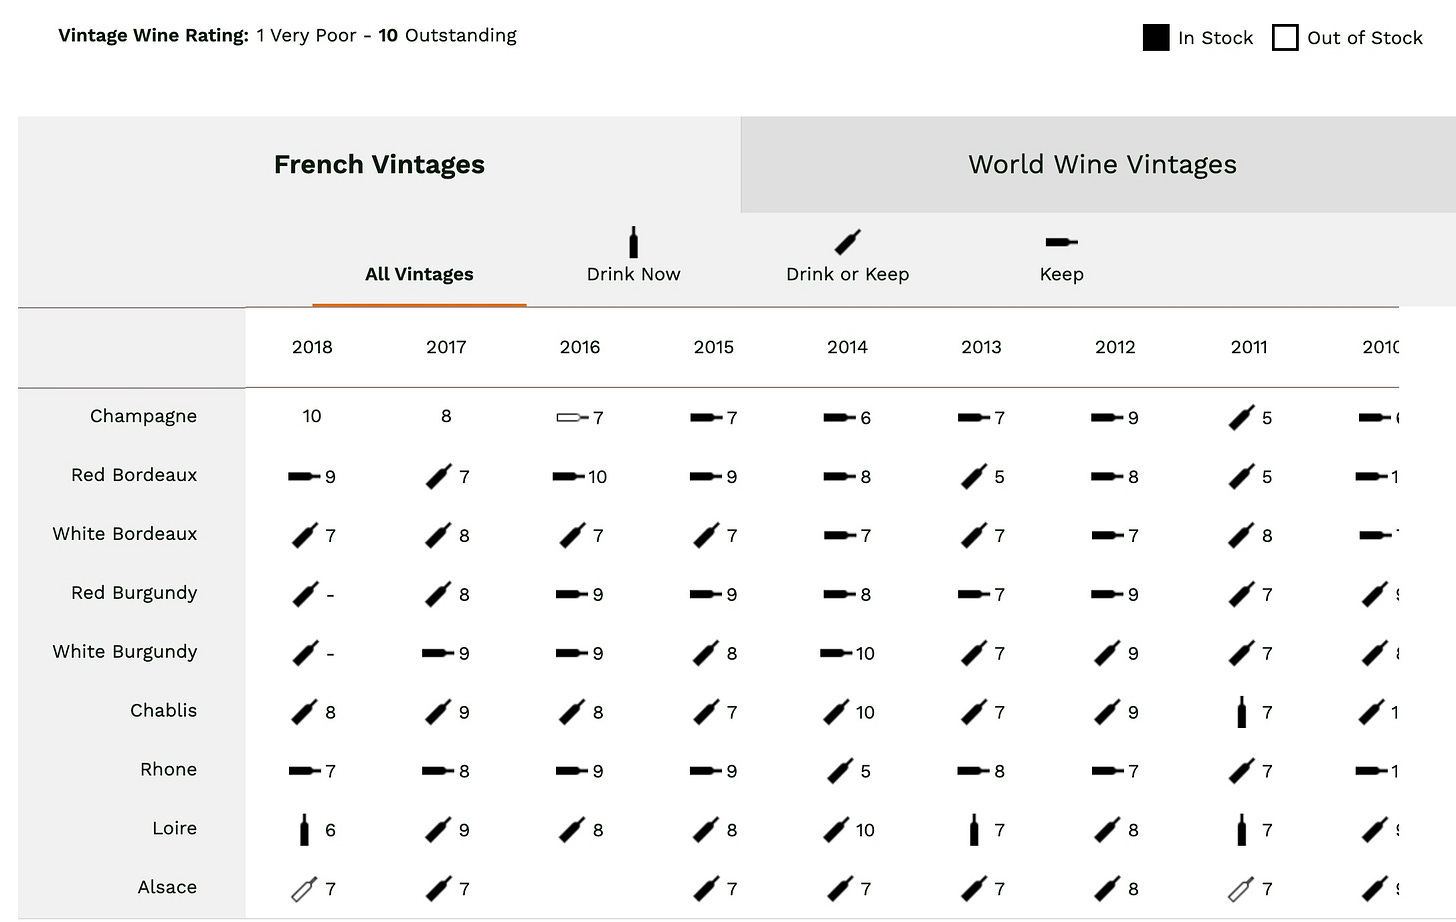
The venerable Berry, Bros & Rudd retail operation out of England is an institution. I included their vintage chart to demonstrate how different kinds of entities have different information to offer in their charts. As you can see, the BB&R vintage chart characteristically includes a rating assessment of the region’s vintage (1-10) and an indication of whether or not the wines from that vintage and region are yet ready to drink. But note the 2016 Champagne and 2018 Alsace: the bottles indicating maturity are outlined, rather than opaque black. It means that BB&R is out of stock of any of those wines.
I’ve come to appreciate the elegance and efficiency of a good vintage chart. In the end, it is a lot of information packed into a very small graphical space. There are some operations that discuss vintage variation, not in terms of a chart, but in prose, explaining, often in detail, exactly what happened with the weather from winter to fall and how all this impacted the final character of the wine. This kind of information is for an even smaller audience than the vintage charts. I note that of those charts displayed above and compared to most charts you’ll find, The Wine Spectator is among the very few that attempts to describe the vintage. I appreciate that effort.


